Lab 08 · Platform Engineering
DevOps Studio › Labs › Lab 08 · ⏱ 3–4 hours · Expert
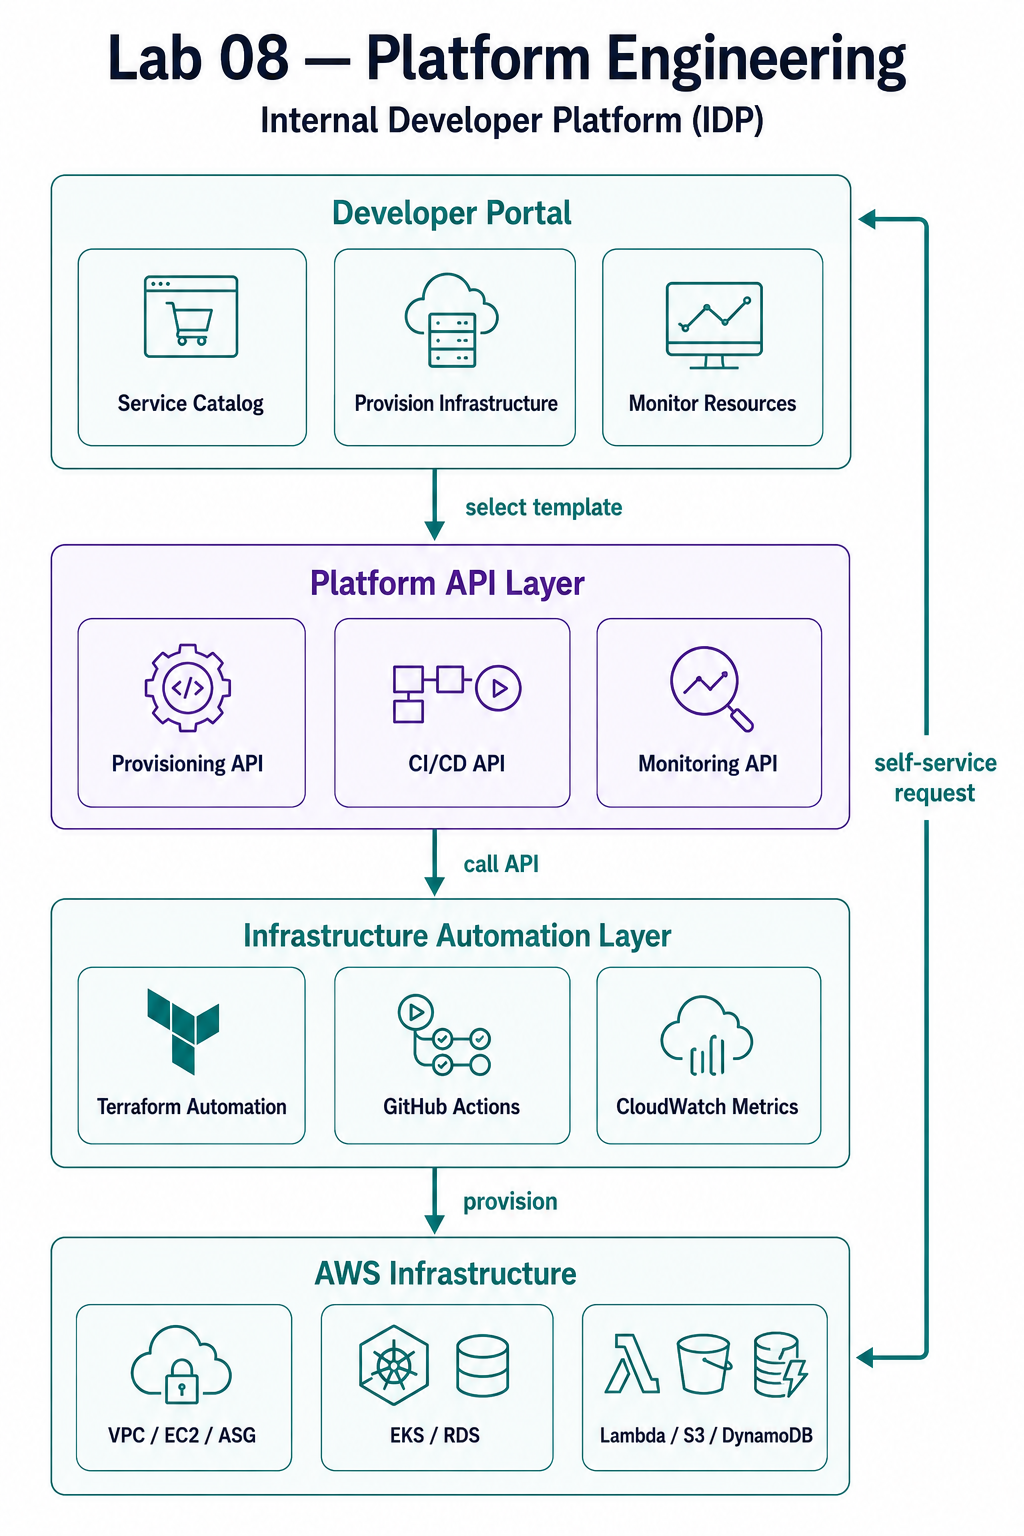
Build an internal developer platform that lets engineers self-serve infrastructure. By the end you'll have a service catalog, a platform API, and automation that provisions real AWS resources from a template.
On this page: Architecture · Prerequisites · Quick Start · Detailed Setup · Project Structure · Core Components · Troubleshooting · Cleanup
What you build
- A service catalog of golden-path templates
- A platform API — provisioning, CI/CD, and monitoring endpoints
- Terraform-based provisioning automation
- A self-service developer portal
- Platform monitoring
Skills you'll practice: internal developer platforms · service catalogs · platform APIs · self-service provisioning · golden paths · Terraform automation.
Architecture
Prerequisites
Required Tools
| Tool | Version | Purpose |
|---|---|---|
| AWS CLI | 2.0+ | AWS service management |
| Terraform | 1.9+ | Infrastructure as Code |
| Docker | 20.10+ | Container runtime |
| kubectl | 1.32+ | Kubernetes management |
| Node.js | 18+ | Portal development |
| Python | 3.9+ | Automation scripts |
AWS Requirements
A real AWS account is required to deploy this lab. It provisions live AWS resources — there is no LocalStack/mock path. Without an account you can still read the code and run
terraform validate/fmt(and CI does), butterraform plan/apply,make apply, andscripts/validate.shall authenticate to AWS and create resources.
- AWS account with credentials configured (
aws configure) and permissions for S3, DynamoDB, IAM, CloudWatch, SSM (platform), plus whatever the service-catalog templates create. - EKS cluster from Lab 02 (or an existing cluster) for the portal/Kubernetes pieces.
- IAM user/role able to create the resources above.
Cost
The platform itself is cheap (S3, DynamoDB, IAM, CloudWatch log group, SSM parameter — pennies, mostly free-tier). Cost comes from the service-catalog templates you choose to provision:
| Template | Provisions | Rough cost |
|---|---|---|
api-service | API Gateway + Lambda + DynamoDB | low (mostly serverless / free-tier) |
data-pipeline | Glue job + EventBridge + CloudWatch | low–moderate (Glue run time) |
web-app | ALB + RDS + Auto Scaling Group | highest — ALB + RDS run hourly |
Use a throwaway/sandbox account, set an AWS Budget alert, provision only the catalog items you want to try (skip web-app if cost-sensitive), and run make destroy as soon as you're done.
Knowledge Prerequisites
- Understanding of Labs 01-07
- Basic Kubernetes knowledge
- Terraform experience
- API design concepts
Lab Dependencies
Recommended: Complete previous labs, especially:
Quick Start
Option 1: Deploy Platform Infrastructure (Foundation)
This sets up the platform foundation (S3, DynamoDB, IAM roles):
# 1. Navigate to lab directory
cd labs/08-platform-engineering

# 2. Configure environment
cp terraform.tfvars.example terraform.tfvars
# Edit terraform.tfvars with your values

# 3. Initialize and deploy
make init
make deploy

# 4. Verify deployment
make validate
Setup time: ~10-15 minutes
Estimated cost: $1-2/month (minimal resources)
Option 2: Use Service Catalog Templates (Immediate Value)
Skip platform setup and use the templates directly:
# Deploy a web application
cd service-catalog/web-app
terraform init
terraform apply

# Deploy an API service
cd ../api-service
terraform init
terraform apply
Setup time: ~15-20 minutes per template
Estimated cost: Varies by template (see template READMEs)
Option 3: Use Automation Tools (Programmatic)
Use the Python scripts for automation:
# Install dependencies
pip install -r automation/terraform-runner/requirements.txt

# Run Terraform automation
python automation/terraform-runner/terraform_runner.py plan \
  --workspace my-app \
  --template service-catalog/web-app \
  --state-bucket YOUR_BUCKET \
  --state-table YOUR_TABLE

# Generate CI/CD pipeline
python automation/ci-cd-generator/generate_pipeline.py \
  --service my-app \
  --repository github.com/org/repo \
  --template standard-web-app
Setup time: ~5 minutes
Estimated cost: No additional cost (uses existing infrastructure)
Detailed Setup
Step 1: Configure AWS Credentials
# Configure AWS CLI
aws configure

# Verify access
aws sts get-caller-identity
Step 2: Set Up Environment Variables
# Create terraform.tfvars
cp terraform.tfvars.example terraform.tfvars

# Edit with your values
# - project_name
# - aws_region
# - eks_cluster_name (from Lab 02)
Step 3: Initialize Terraform
terraform initStep 4: Review and Deploy
# Review plan
terraform plan

# Deploy platform
terraform apply
Project Structure
labs/08-platform-engineering/
├── README.md                    # This file - Start here!
├── PLATFORM-ARCHITECTURE.md     # Detailed architecture explanation
├── Makefile                     # Automation commands
├── main.tf                      # Main Terraform configuration
├── variables.tf                 # Variable definitions
├── outputs.tf                   # Output values
├── terraform.tfvars.example     # Example configuration
│
├── service-catalog/             # Service Catalog - Ready-to-use templates
│   ├── README.md               # How to use the service catalog
│   ├── web-app/                # Web Application Template
│   │   ├── README.md           # Template documentation
│   │   └── main.tf             # WORKING Terraform template
│   ├── api-service/            # API Service Template
│   │   ├── README.md           # Template documentation
│   │   └── main.tf             # WORKING Terraform template
│   └── data-pipeline/          # Data Pipeline Template
│       ├── README.md           # Template documentation
│       └── main.tf             # WORKING Terraform template
│
├── platform-api/                # Platform APIs - Lambda functions
│   ├── README.md               # API documentation
│   ├── provisioning/           # Provisioning API
│   │   ├── README.md           # API endpoint docs
│   │   └── lambda_function.py  # WORKING Lambda function
│   └── monitoring/             # Monitoring API
│       ├── README.md           # API endpoint docs
│       └── lambda_function.py  # WORKING Lambda function
│
├── automation/                  # Automation Tools - Working scripts
│   ├── README.md               # Automation overview
│   ├── terraform-runner/       # Terraform execution automation
│   │   ├── README.md           # How to use the runner
│   │   ├── terraform_runner.py # WORKING Python script
│   │   └── requirements.txt    # Python dependencies
│   └── ci-cd-generator/        # CI/CD pipeline generator
│       ├── README.md           # How to use the generator
│       └── generate_pipeline.py # WORKING Python script
│
├── monitoring/                  # Platform Monitoring - Dashboards & Metrics
│   ├── README.md               # Monitoring overview
│   ├── dashboards/             # CloudWatch dashboards
│   │   ├── README.md           # Dashboard documentation
│   │   ├── platform-health.json # WORKING dashboard config
│   │   └── cost-tracking.json  # WORKING dashboard config
│   └── metrics/                # Custom metrics
│       ├── README.md           # Metrics documentation
│       └── publish_metrics.py  # WORKING metrics script
│
├── portal/                      # Developer Portal (Optional)
│   ├── README.md               # Portal setup guide
│   └── config/                 # Portal configuration
│       └── app-config.yaml     # Example portal config
│
├── backstage/                   # Backstage Portal (Optional)
│   └── README.md               # Backstage setup guide
│
└── scripts/                     # Utility Scripts
└── validate.sh # WORKING validation scriptLegend:
- = Working implementation (actual code you can run)
- 📄 = Documentation only
What's Included (Working Implementations)
This lab includes actual working code you can use immediately:
Service Catalog Templates (3 Ready-to-Use Templates)
Location: service-catalog/
Web Application (
web-app/main.tf)- Complete Terraform template
- Provisions: ALB, Auto Scaling Group, RDS database
- Ready to deploy with
terraform apply - See web-app/README.md for usage
API Service (
api-service/main.tf)- Complete Terraform template
- Provisions: API Gateway, Lambda functions, DynamoDB
- Serverless API ready to use
- See api-service/README.md for usage
Data Pipeline (
data-pipeline/main.tf)- Complete Terraform template
- Provisions: AWS Glue jobs, S3 buckets, EventBridge schedules
- ETL pipeline ready to configure
- See data-pipeline/README.md for usage
How to Use:
# Example: Deploy web application template
cd service-catalog/web-app
terraform init
terraform plan
terraform apply
Platform APIs (2 Working Lambda Functions)
Location: platform-api/
Provisioning API (
provisioning/lambda_function.py)- Lambda function for infrastructure provisioning
- Handles POST
/api/v1/provisionrequests - Returns provisioning status
- Ready to deploy to AWS Lambda
- See provisioning/README.md for API docs
Monitoring API (
monitoring/lambda_function.py)- Lambda function for metrics and monitoring
- Handles GET
/api/v1/metricsrequests - Queries CloudWatch metrics
- Ready to deploy to AWS Lambda
- See monitoring/README.md for API docs
How to Use:
# Deploy Lambda functions (via Terraform or manually)
# Then call via API Gateway or directly
aws lambda invoke --function-name provisioning-api --payload '{"template":"web-app"}'
Automation Tools (2 Working Python Scripts)
Location: automation/
Terraform Runner (
terraform-runner/terraform_runner.py)- Python script that executes Terraform in isolated workspaces
- Manages state in S3 with DynamoDB locking
- Supports: plan, apply, destroy operations
- Ready to run:
python terraform_runner.py plan --workspace my-app --template ../service-catalog/web-app - See terraform-runner/README.md for usage
CI/CD Generator (
ci-cd-generator/generate_pipeline.py)- Python script that generates GitHub Actions workflows
- Creates deploy pipelines for multiple environments
- Ready to run:
python generate_pipeline.py --service my-app --repository github.com/org/repo --template standard-web-app - See ci-cd-generator/README.md for usage
How to Use:
# Install dependencies
pip install -r automation/terraform-runner/requirements.txt

# Run Terraform runner
python automation/terraform-runner/terraform_runner.py plan \
  --workspace my-app-dev \
  --template service-catalog/web-app \
  --state-bucket my-state-bucket \
  --state-table my-state-table

# Generate CI/CD pipeline
python automation/ci-cd-generator/generate_pipeline.py \
  --service my-app \
  --repository github.com/myorg/my-app \
  --template standard-web-app
Monitoring Tools (Dashboards & Metrics Scripts)
Location: monitoring/
CloudWatch Dashboards (
dashboards/)platform-health.json- Platform health metrics dashboardcost-tracking.json- Cost monitoring dashboard- Ready to import:
aws cloudwatch put-dashboard --dashboard-name platform-health --dashboard-body file://dashboards/platform-health.json - See dashboards/README.md for usage
Metrics Publisher (
metrics/publish_metrics.py)- Python script to publish custom metrics to CloudWatch
- Supports: provisioning, API, and resource metrics
- Ready to run:
python publish_metrics.py provisioning true 120 - See metrics/README.md for usage
How to Use:
# Import dashboards
aws cloudwatch put-dashboard \
  --dashboard-name platform-health \
  --dashboard-body file://monitoring/dashboards/platform-health.json

# Publish metrics
python monitoring/metrics/publish_metrics.py provisioning true 120
📄 Documentation & Configuration
- Portal Configuration (
portal/config/app-config.yaml) - Example portal config - Backstage Setup (
backstage/README.md) - Optional Backstage portal guide - Architecture Docs (
PLATFORM-ARCHITECTURE.md) - Detailed architecture explanation
Core Components Explained
Service Catalog
What it is: Pre-built Terraform templates for common infrastructure patterns.
What you get:
- 3 complete Terraform templates (web-app, api-service, data-pipeline)
- Each template is production-ready with security, monitoring, and best practices
- Documentation for each template
- Parameter examples
How to use: Navigate to a template directory, configure variables, run terraform apply.
Platform APIs
What it is: Lambda functions that provide REST API endpoints for platform operations.
What you get:
- Provisioning API Lambda function (provision infrastructure via API)
- Monitoring API Lambda function (query metrics via API)
- API documentation with request/response examples
How to use: Deploy Lambda functions, set up API Gateway, call endpoints via HTTP.
Automation Tools
What it is: Python scripts that automate common platform operations.
What you get:
- Terraform Runner: Automates Terraform execution with workspace isolation
- CI/CD Generator: Creates GitHub Actions workflows automatically
How to use: Run Python scripts with appropriate parameters.
Monitoring
What it is: CloudWatch dashboards and metrics publishing tools.
What you get:
- 2 CloudWatch dashboard configurations (health, cost)
- Python script to publish custom metrics
How to use: Import dashboards to CloudWatch, run metrics script to publish data.
Step-by-Step Tutorials
Tutorial 1: Deploy Your First Service Template
Objective: Use the web application template to provision infrastructure.
What you'll do: Deploy a complete web application stack (ALB, ASG, RDS) using the provided Terraform template.
Steps:
Navigate to Template
bashcd labs/08-platform-engineering/service-catalog/web-appReview the Template
bash# Look at what will be created cat main.tf cat README.mdConfigure Variables
bash# Create terraform.tfvars cat > terraform.tfvars <<EOF app_name = "my-first-app" environment = "dev" instance_type = "t3.medium" min_size = 2 max_size = 5 EOFInitialize and Deploy
bash# Initialize Terraform terraform init # Review what will be created terraform plan # Deploy (when ready) terraform applyAccess Your Application
bash# Get the ALB DNS name terraform output alb_dns_name # Visit in browser or curl curl http://$(terraform output -raw alb_dns_name)
What you learned:
- How to use service catalog templates
- Terraform variable configuration
- Infrastructure provisioning
Cleanup:
terraform destroyTutorial 2: Use the Terraform Runner
Objective: Use the automation script to provision infrastructure programmatically.
What you'll do: Use the Python Terraform Runner script to execute Terraform in an isolated workspace.
Steps:
Set Up Prerequisites
bash# Install Python dependencies pip install -r automation/terraform-runner/requirements.txt # Get platform state bucket and table (from main.tf outputs) cd labs/08-platform-engineering terraform output platform_state_bucket terraform output platform_state_lock_tableRun Terraform Plan
bashpython automation/terraform-runner/terraform_runner.py plan \ --workspace my-app-dev \ --template service-catalog/web-app \ --state-bucket $(terraform output -raw platform_state_bucket) \ --state-table $(terraform output -raw platform_state_lock_table) \ --variables '{"app_name":"my-app","environment":"dev"}'Apply the Plan
bashpython automation/terraform-runner/terraform_runner.py apply \ --workspace my-app-dev \ --template service-catalog/web-app \ --state-bucket $(terraform output -raw platform_state_bucket) \ --state-table $(terraform output -raw platform_state_lock_table)
What you learned:
- Automated Terraform execution
- Workspace isolation
- State management
Tutorial 3: Generate a CI/CD Pipeline
Objective: Automatically create a GitHub Actions workflow for your service.
What you'll do: Use the CI/CD generator script to create a deployment pipeline.
Steps:
Generate Pipeline
bashpython automation/ci-cd-generator/generate_pipeline.py \ --service my-web-app \ --repository github.com/myorg/my-web-app \ --template standard-web-app \ --environments dev staging prod \ --output .github/workflows/deploy.ymlReview Generated Pipeline
bashcat .github/workflows/deploy.ymlCommit to Repository
bashgit add .github/workflows/deploy.yml git commit -m "Add CI/CD pipeline" git push
What you learned:
- Automated pipeline generation
- Multi-environment deployments
- GitHub Actions workflow creation
Tutorial 4: Set Up Monitoring Dashboards
Objective: Import CloudWatch dashboards to monitor your platform.
What you'll do: Import the provided dashboard configurations into CloudWatch.
Steps:
Import Platform Health Dashboard
bashaws cloudwatch put-dashboard \ --dashboard-name platform-health \ --dashboard-body file://monitoring/dashboards/platform-health.jsonImport Cost Tracking Dashboard
bashaws cloudwatch put-dashboard \ --dashboard-name platform-cost \ --dashboard-body file://monitoring/dashboards/cost-tracking.jsonView Dashboards
bash# Open AWS Console and navigate to CloudWatch > Dashboards # Or get dashboard URL aws cloudwatch get-dashboard --dashboard-name platform-healthPublish Custom Metrics
bash# Publish a provisioning success metric python monitoring/metrics/publish_metrics.py provisioning true 120 # Publish API metrics python monitoring/metrics/publish_metrics.py api 1000 5 250
What you learned:
- CloudWatch dashboard setup
- Custom metrics publishing
- Platform observability
Advanced Patterns
Pattern 1: Multi-Tenancy
Support multiple teams with:
- Namespace isolation
- Resource quotas
- Team-specific catalogs
Pattern 2: Approval Workflows
Add approvals for:
- Production deployments
- High-cost resources
- Security-sensitive changes
Pattern 3: Custom Templates
Create team-specific templates:
- Domain-specific services
- Custom configurations
- Team best practices
Pattern 4: Cost Optimization
Automated cost optimization:
- Right-sizing recommendations
- Unused resource cleanup
- Reserved instance management
Monitoring and Metrics
Platform Metrics
Monitor:
- Provisioning Rate - Services created per day
- Success Rate - Successful vs failed provisions
- Time to Provision - Average provisioning time
- Resource Utilization - CPU, memory, storage
- Cost per Service - Cost tracking
Developer Metrics
Track:
- Active Developers - Platform usage
- Services per Developer - Productivity
- Time to First Deploy - Developer experience
- Support Tickets - Platform issues
Cost Metrics
Monitor:
- Total Platform Cost - Overall spending
- Cost per Service - Service-level costs
- Cost Trends - Spending patterns
- Budget Alerts - Cost thresholds
See monitoring/README.md for detailed setup.
Troubleshooting
Common Issues
Portal Not Accessible:
- Check ingress configuration
- Verify DNS settings
- Check security groups
Provisioning Fails:
- Check Terraform logs
- Verify IAM permissions
- Review resource limits
CI/CD Pipeline Issues:
- Check GitHub Actions logs
- Verify repository access
- Review pipeline configuration
See the Troubleshooting guide for detailed solutions.
Cleanup
Remove All Resources
# Destroy platform
terraform destroy

# Or use Makefile
make destroyImportant: Always destroy resources when not in use to avoid costs!
Cost Considerations
Estimated Costs
Monthly Cost (if running continuously): ~$80-120
- Portal infrastructure: $30-50/month
- Platform APIs: $20-30/month
- Monitoring: $10-20/month
- Automation: $20-30/month
Cost to Complete (run for 3-4 hours): ~$5-10
- Portal deployment: Minimal
- API usage: Pay-per-request
- Monitoring: Included
- Infrastructure: Pay-per-use
Cost Optimization
- Use spot instances for non-critical components
- Right-size portal infrastructure
- Monitor and optimize API usage
- Destroy test resources immediately
Next Steps
Immediate Next Actions
- Deploy the platform and verify all components
- Create your first service from the catalog
- Set up monitoring and dashboards
- Document your platform for your team
Continue Your Learning Journey
The Full Sequence
- Lab 01: Terraform Foundations
- Lab 02: Kubernetes Platform
- Lab 03: CI/CD Pipelines
- Lab 04: Observability Stack
- Lab 05: Security Automation
- Lab 06: GitOps Workflows
- Lab 07: Serverless Operations
- Lab 08: Platform Engineering
Where This Shows Up
The patterns above are the ones that come up when:
- Delivery teams are stuck filing tickets for infrastructure they could provision themselves
- A new service needs to start from a paved-road template instead of a blank repo
- Developer productivity is blocked by tooling gaps, not skill gaps
- Governance needs to be enforced automatically, not through a manual review queue
Additional Resources
Documentation
Learning Resources
Outcome: all eight labs now run as one platform — infrastructure, container platform, delivery pipeline, observability, security automation, GitOps, serverless operations, and a self-service developer platform on top of it.
Navigation: ◀ Lab 07 · Serverless Operations · All labs