Lab 04 · Observability Stack
DevOps Studio › Labs › Lab 04 · ⏱ 2–3 hours · Advanced
See what your systems are actually doing — metrics, logs, and traces in one place. By the end you'll have Prometheus, Grafana, Jaeger, and OpenSearch wired together with dashboards and alerts.
On this page: Architecture · Prerequisites · Quick Start · Detailed Setup · Project Structure · Components · Troubleshooting · Cleanup
What you build
- Prometheus — metrics collection
- Grafana — dashboards
- Jaeger — distributed traces
- OpenSearch + Fluent Bit — log aggregation
- Alertmanager — alerting on the metrics
Skills you'll practice: the three pillars (metrics, logs, traces) · Prometheus queries · Grafana dashboards · distributed tracing · log aggregation · alerting.
Architecture
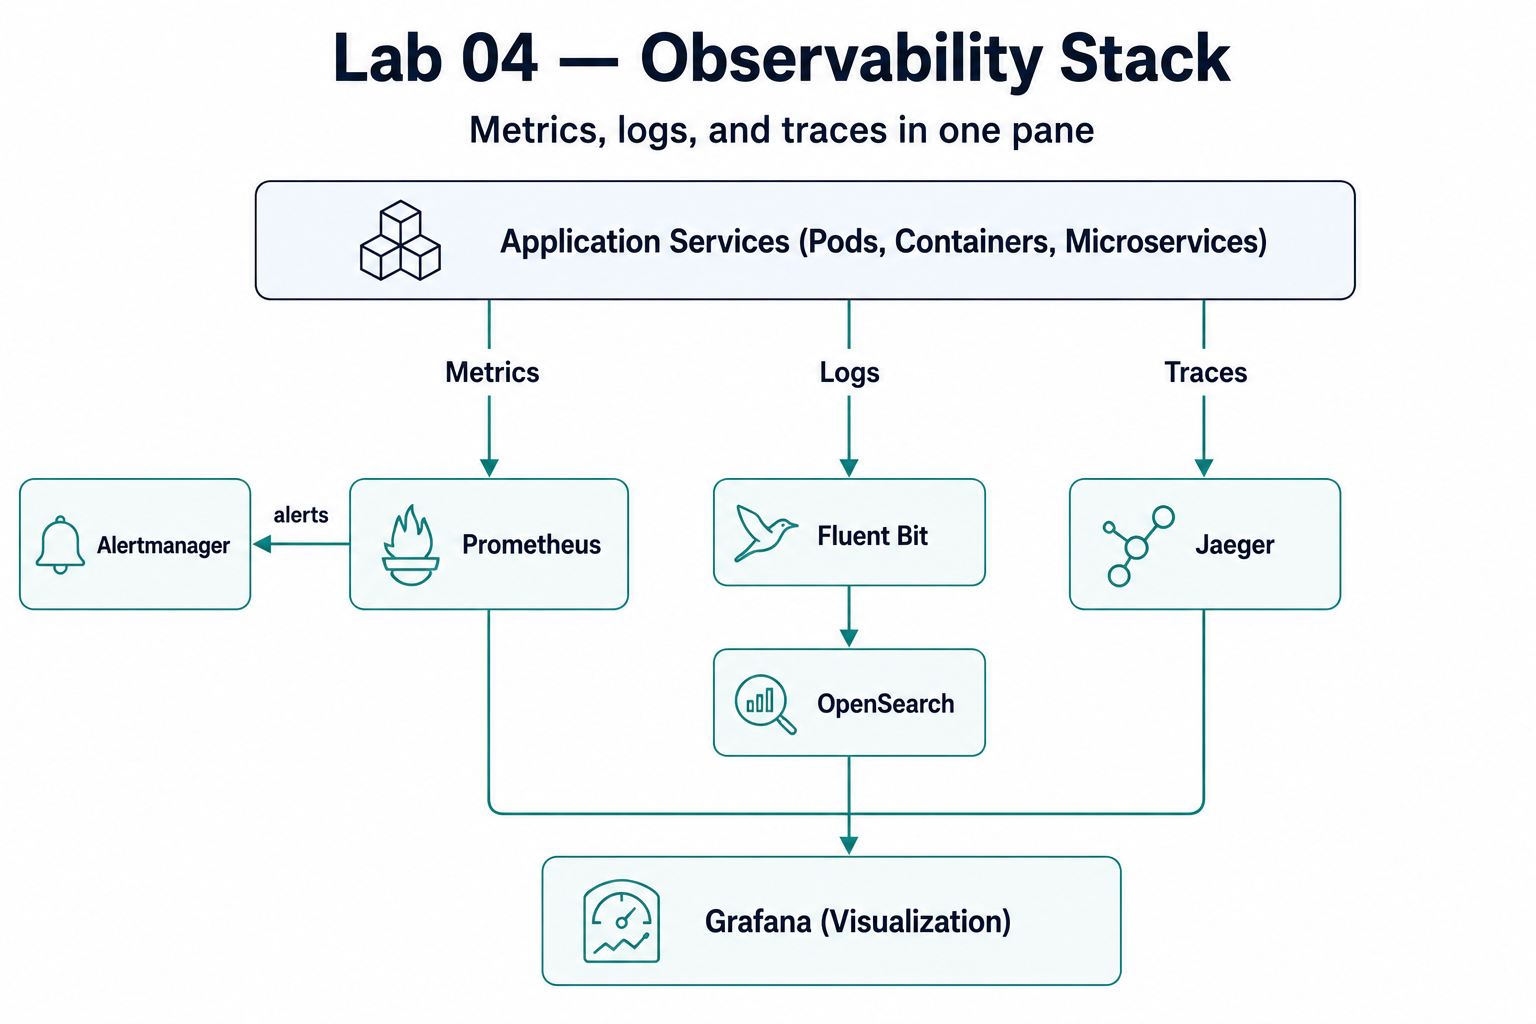
Data Flow
- Metrics: Applications → Prometheus → Grafana
- Logs: Applications → Fluent Bit → OpenSearch → Grafana
- Traces: Applications → Jaeger → Grafana
Prerequisites
Required Tools
| Tool | Version | Purpose |
|---|---|---|
| kubectl | 1.32+ | Kubernetes cluster management |
| Helm | 3.10+ | Package management |
| curl | Latest | API testing |
AWS Requirements
- EKS Cluster from Lab 02 (or existing Kubernetes cluster)
- kubectl configured to access the cluster
Knowledge Prerequisites
- Basic Kubernetes concepts
- Understanding of Lab 02 (Kubernetes Platform)
- Basic understanding of monitoring concepts
Lab Dependencies
Required: Complete Lab 02 first to have an EKS cluster.
Quick Start
For experienced users who want to deploy immediately:
# 1. Navigate to lab directory
cd labs/04-observability-stack

# 2. Install complete stack
make install-all

# 3. Access dashboards (in separate terminals)
kubectl port-forward -n observability svc/grafana 3000:80
kubectl port-forward -n observability svc/prometheus-kube-prometheus-prometheus 9090:9090
kubectl port-forward -n observability svc/jaeger-query 16686:16686
kubectl port-forward -n observability svc/opensearch-dashboards 5601:5601

# 4. Open in browser
# Grafana: http://localhost:3000 (admin/admin)
# Prometheus: http://localhost:9090
# Jaeger: http://localhost:16686
# OpenSearch: http://localhost:5601 (admin/admin)
Setup time: ~10-15 minutes
Estimated cost: $2-5 to complete (vs $40-60/month if kept running)
Detailed Setup
Step 1: Verify Cluster Access
# Check kubectl is configured
kubectl cluster-info
kubectl get nodes
Step 2: Install Components
You can install components individually or all at once:
# Install all at once (recommended)
make install-all

# Or install individually
make install-prometheus
make install-grafana
make install-jaeger
make install-opensearch
Step 3: Verify Installation
# Check status
make status

# Or manually
kubectl get pods -n observability
Project Structure
labs/04-observability-stack/
├── README.md                    # This file
├── Makefile                     # Automation commands
├── prometheus/                  # Prometheus configurations
│   └── (Helm chart)
├── grafana/                     # Grafana configurations
│   └── (Helm chart)
├── jaeger/                      # Jaeger configurations
│   └── (Helm chart)
├── opensearch/                  # OpenSearch configurations
│   ├── README.md               # OpenSearch guide
│   ├── manifests/              # Kubernetes manifests
│   │   ├── opensearch-cluster.yaml
│   │   ├── opensearch-dashboards.yaml
│   │   └── fluent-bit-config.yaml
│   └── config/                 # Configuration files
└── scripts/                     # Automation scripts
Components
Prometheus (Metrics)
What it does: Collects and stores metrics as time-series data.
Key Features:
- Scrapes metrics from services
- Stores time-series data
- PromQL query language
- Alerting rules
Access: kubectl port-forward -n observability svc/prometheus-kube-prometheus-prometheus 9090:9090
Grafana (Visualization)
What it does: Creates dashboards and visualizations from metrics, logs, and traces.
Key Features:
- Connect to Prometheus, OpenSearch, Jaeger
- Pre-built dashboards
- Custom dashboard creation
- Alerting
Access: kubectl port-forward -n observability svc/grafana 3000:80
Credentials: admin / admin
Jaeger (Distributed Tracing)
What it does: Traces requests across multiple services in microservices architectures.
Key Features:
- Request flow visualization
- Service dependency mapping
- Performance bottleneck identification
- Trace search and analysis
Access: kubectl port-forward -n observability svc/jaeger-query 16686:16686
OpenSearch (Log Aggregation)
What it does: Stores, searches, and analyzes application logs.
Key Features:
- Centralized log storage
- Full-text search
- Real-time log analysis
- OpenSearch Dashboards UI
Access: kubectl port-forward -n observability svc/opensearch-dashboards 5601:5601
Credentials: admin / admin
See opensearch/README.md for detailed OpenSearch documentation.
Integration
Grafana Data Sources
Grafana can connect to all components:
- Prometheus: Metrics visualization
- OpenSearch: Log queries and dashboards
- Jaeger: Trace visualization
Complete Observability
With all components, you can:
- Monitor system health (Prometheus + Grafana)
- Search application logs (OpenSearch)
- Trace request flows (Jaeger)
- Visualize everything (Grafana)
Usage Examples
Query Metrics in Prometheus
# CPU usage
rate(container_cpu_usage_seconds_total[5m])

# Memory usage
container_memory_usage_bytes

# Request rate
rate(http_requests_total[5m])
Search Logs in OpenSearch
# Search for errors
curl -X GET "opensearch:9200/kubernetes-logs/_search?q=level:ERROR" \
  -u admin:admin

# Get logs by service
curl -X GET "opensearch:9200/kubernetes-logs/_search" \
  -u admin:admin \
  -H 'Content-Type: application/json' \
  -d '{
    "query": {
      "match": {
        "kubernetes.labels.app": "sample-app"
      }
    }
  }'
View Traces in Jaeger
- Open Jaeger UI
- Select service
- Click "Find Traces"
- View trace timeline and spans
Troubleshooting
Components Not Starting
# Check pod status
kubectl get pods -n observability

# Check logs
kubectl logs -n observability <pod-name>

# Check events
kubectl describe pod -n observability <pod-name>
High Resource Usage
# Check resource usage
kubectl top pods -n observability

# Adjust resource limits in manifests
Connection Issues
# Test service connectivity
kubectl run -it --rm debug --image=curlimages/curl --restart=Never -- \
  curl http://opensearch:9200/_cluster/health
Cleanup
Remove All Components
# Uninstall everything
make uninstall-all

# Or manually
kubectl delete namespace observability
Cost Considerations
Estimated Costs
Monthly Cost (if running continuously): ~$40-60
- Prometheus: $10-15/month
- Grafana: $5-10/month
- Jaeger: $5-10/month
- OpenSearch: $20-30/month (storage)
Cost to Complete (run for 2-3 hours): ~$2-5
- Component deployment: Minimal
- Storage: Negligible for short-term
- Compute: Included in cluster costs
Cost Optimization
- Use smaller node sizes for dev/test
- Set log retention policies
- Archive old logs to S3
- Use managed services (AWS OpenSearch Service) for production
Next Steps
Immediate Next Actions
- Explore dashboards in Grafana
- Search logs in OpenSearch
- View traces in Jaeger
- Create custom dashboards
Continue Your Learning Journey
Next Recommended Lab
- Lab 05 - Security Automation - Secure your observability stack
Related Labs
- Lab 02: Kubernetes Platform - Monitor this cluster
- Lab 03: CI/CD Pipelines - Monitor deployments
Additional Resources
Documentation
Learning Resources
- Observability Tools Explained - Understanding metrics, logs, and traces
- Prometheus Best Practices
- Grafana Dashboard Examples
Outcome: metrics, logs, and traces are now flowing into Grafana — the visibility an operator needs to detect and investigate production issues.
Next: Lab 05 · Security Automation — add guardrails to this platform.
Navigation: ◀ Lab 03 · CI/CD Pipelines · All labs · Lab 05 · Security Automation ▶